Tsotso Report |
||||||||||||
Results |
||||||||||||
| History Quality: | 99% real ticks | |||||||||||
| Bars: | 117743 | Ticks: | 74794157 | Symbols: | 1 | |||||||
| Total Net Profit: | 325 859.09 | Balance Drawdown Absolute: | 0.33 | Equity Drawdown Absolute: | 20 259.97 | |||||||
| Gross Profit: | 606 338.90 | Balance Drawdown Maximal: | 37 839.31 (9.15%) | Equity Drawdown Maximal: | 70 608.96 (25.37%) | |||||||
| Gross Loss: | -280 479.81 | Balance Drawdown Relative: | 11.62% (21 962.32) | Equity Drawdown Relative: | 47.11% (26 489.80) | |||||||
| Profit Factor: | 2.16 | Expected Payoff: | 190.78 | Margin Level: | 480.86% | |||||||
| Recovery Factor: | 4.61 | Sharpe Ratio: | 2.24 | Z-Score: | -1.79 (92.65%) | |||||||
| AHPR: | 1.0012 (0.12%) | LR Correlation: | 0.98 | OnTester result: | 0.9536310262761696 | |||||||
| GHPR: | 1.0012 (0.12%) | LR Standard Error: | 24 175.34 | |||||||||
| Total Trades: | 1708 | Short Trades (won %): | 770 (66.75%) | Long Trades (won %): | 938 (71.64%) | |||||||
| Total Deals: | 3416 | Profit Trades (% of total): | 1186 (69.44%) | Loss Trades (% of total): | 522 (30.56%) | |||||||
| Largest profit trade: | 50 686.59 | Largest loss trade: | -17 943.75 | |||||||||
| Average profit trade: | 511.25 | Average loss trade: | -522.84 | |||||||||
| Maximum consecutive wins ($): | 17 (289.51) | Maximum consecutive losses ($): | 5 (-37 706.76) | |||||||||
| Maximal consecutive profit (count): | 56 105.98 (2) | Maximal consecutive loss (count): | -37 706.76 (5) | |||||||||
| Average consecutive wins: | 3 | Average consecutive losses: | 2 | |||||||||
 |
||||||||||||
|---|---|---|---|---|---|---|---|---|---|---|---|---|
 |
||||||||||||
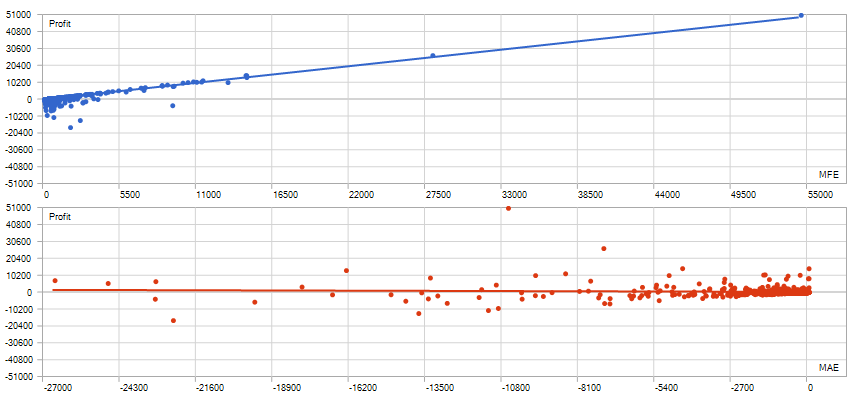
| Correlation (Profits,MFE): | 0.88 | Correlation (Profits,MAE): | -0.05 | Correlation (MFE,MAE): | -0.3733 | |||||||
 |
||||||||||||
| Minimal position holding time: | 0:00:02 | Maximal position holding time: | 224:21:31 | Average position holding time: | 8:49:01 | |||||||
 |
||||||||||||